Measuring Our Impact

We use performance metrics to measure our progress, recognize trends and identify opportunities for improvement. Our climate-related metrics help inform the action steps needed for us to achieve our net zero (Scope 1 and Scope 2) GHG emissions goal by 2035.

Chesapeake continues to monitor industry best practices and participate with third-party organizations to improve data reporting and accuracy. Our GHG emissions intensity and methane emissions intensity metrics are reviewed and verified by an independent, third-party organization.

2023 Metrics by Operating Area
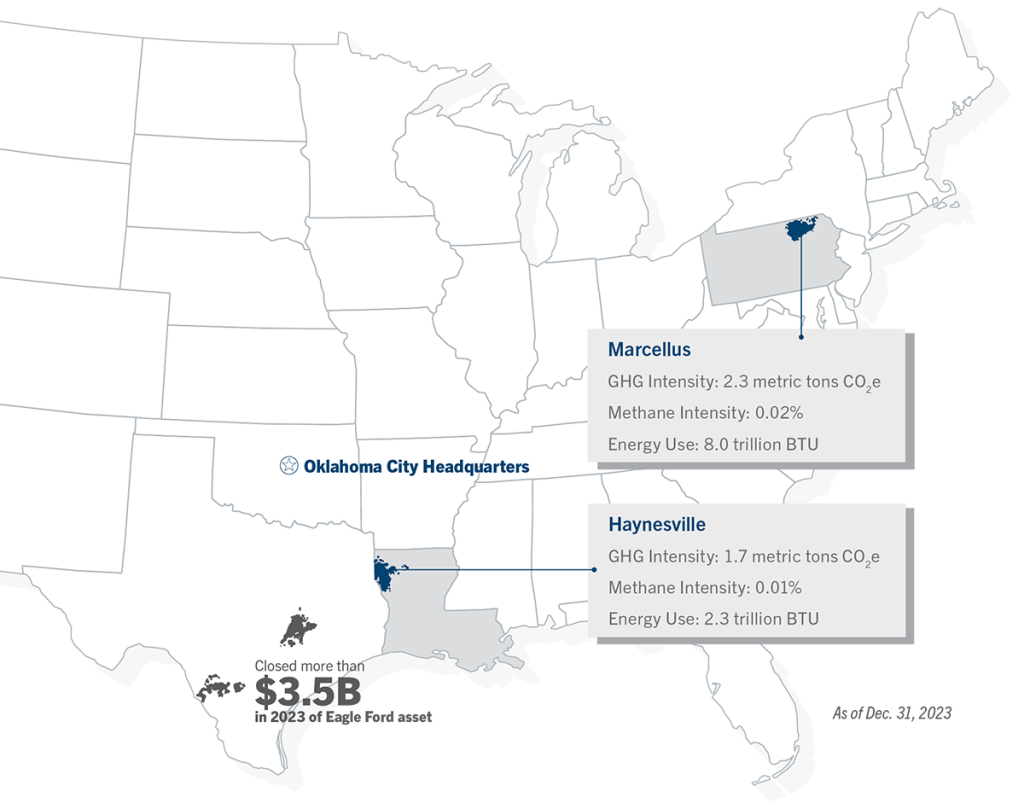
For additional sustainability performance metrics, view our 2023 Sustainability Report.

Metric202320222021
Enterprise Scope 1 GHG emissions (million metric tons CO2e)(1)0.801.731.83
Carbon dioxide (million metric tons)0.631.131.09
Methane (million metric tons CO2e).017.059.074
Methane (% of Scope 1)21%34%40%
Nitrous oxide (million metric tons CO2e)0.0010.0010.001
Flared hydrocarbons (metric tons CO2e)09,83624,327
Other combustion (metric tons CO2e)627,8341,119,1591,050,328
Process emissions (metric tons CO2e)4,57413,92720,323
Other vented emissions (metric tons CO2e)151,204552,751696,120
Fugitive emissions (metric tons CO2e)15,76323,78932,334
Enterprise Scope 1 GHG emissions intensity (metric tons CO2e / gross mboe produced)(1)2.03.94.5
Enterprise Scope 1 and Scope 2 methane emissions intensity (volume methane emissions / volume gross natural gas produced)(1) 0.02%0.05%0.07%
Haynesville0.01%0.02%0.03%
Marcellus0.02%0.02%0.01%
Enterprise Scope 2 GHG emissions (million metric tons CO2e)(2)0.0040.0530.057
Enterprise Scope 1 and Scope 2 GHG emissions intensity (metric tons CO2e / gross mboe produced) 2.14.14.6
Haynesville1.72.02.4
Marcellus2.32.91.9
Enterprise Scope 3 GHG emissions (million metric tons CO2e)(3)678259
Energy use, fuel and electricity consumption (trillion BTU)10.417.6
Corporate Headquarters (OKC)0.10.1
Haynesville2.32.5
Marcellus8.08.8

2022 Scope 1 GHG emissions are restated herein after a recent revision to our EPA Greenhouse Gas Reporting.

Data and information included in this report were subject to internal review and are believed to be correct at the time of reporting. Data reflects year-end calculations.
For certain reporting elements, later revisions or changes in categorization could affect data after publication.


(1) Emissions estimate developed under the EPA’s Greenhouse Gas Reporting Program (operated onshore production).
(2) Chesapeake calculates its reported emissions using EPA eGRID subregion emission factors.
(3) Chesapeake reports our estimated indirect Scope 3 emissions on an equity basis using Category 11 of the Estimating petroleum industry value chain (Scope 3) greenhouse gas emissions reporting guidance developed by Ipieca / API (2016). The calculation methodology applies the EPA’s emission factors for listed fuel types; representing indirect end use greenhouse gas emissions of the products created from our crude oil and natural gas..

Scroll to Top