Using Scenarios to Understand Risks, Opportunities
Chesapeake utilizes the International Energy Agency (IEA)’s World Energy Outlook (WEO) to assess the company’s current portfolio against potential scenarios in a lower carbon future. This analysis is in addition to the industry outlook research we utilize as part of our strategic planning — including economic and policy projections, supply and demand forecasts and future business conditions.
IEA has published its WEO, an analysis of global energy projections, annually since 1998. The outlook is widely recognized across the energy industry as a resource for examining future energy trends across scenarios that “reflect different assumptions about the actions taken in the coming years to shape energy systems and reduce energy-related CO2 emissions.”(1)
2023 WEO’s Three Scenarios(2)
Stated Policies Scenario (STEPS)
Provides direction of the energy system as it progresses based on the current policy landscape (looks at the government / regulatory state as it is today)
Announced Pledges Scenario (APS)
Assumes that governments will meet their national determined contribution (formally submitted to the UNFCCC) and other announced climate-related commitments, including longer-term net zero targets
Net Zero Emissions by 2050 (NZE) Scenario
Portrays a pathway for limiting the global temperature rise to 1.5°C above preindustrial levels in 2100 and meeting the key energy-related UN Sustainable Development Goals, including universal access to reliable, modern energy
Associated temperature rise in 2100: 2.4°C
Associated temperature rise in 2100: 1.7°C
Paris Agreement-aligned
Associated temperature rise in 2100: 1.5°C
Paris Agreement-aligned
It’s important to note that all the defined scenarios provide studied constructs of the future, but they’re not forecasts. They represent potential futures, identifying possible trends or factors that could influence business models should a scenario’s key assumptions occur. Many of the scenarios also assume the adoption of technologies that are either unproven or are in various stages of development. As a result, the supply and demand analysis conducted in the WEO may not fully represent the future energy environment and landscape.
Current Energy Landscape and Future Demand Impact
Foundational to its analysis, the IEA describes the current state of the energy landscape before presenting its future projections. This description notes the world’s growing modern energy needs overlayed with a global desire and pathway to limit rising temperatures. The WEO also notes the need for people-centered transitions focused on both access and affordability.(3)
Populations are growing; energy access can’t keep up with the pace
In all three scenarios, the global economy is assumed to grow by more than 2% each year and the global population is assumed to rise from 8 billion people in 2022 to 9.7 billion in 2050. Much of this population growth will occur in urban areas, predominantly in Africa and Asia.(4)
Change in population in urban and rural areas by region to 2050(5)
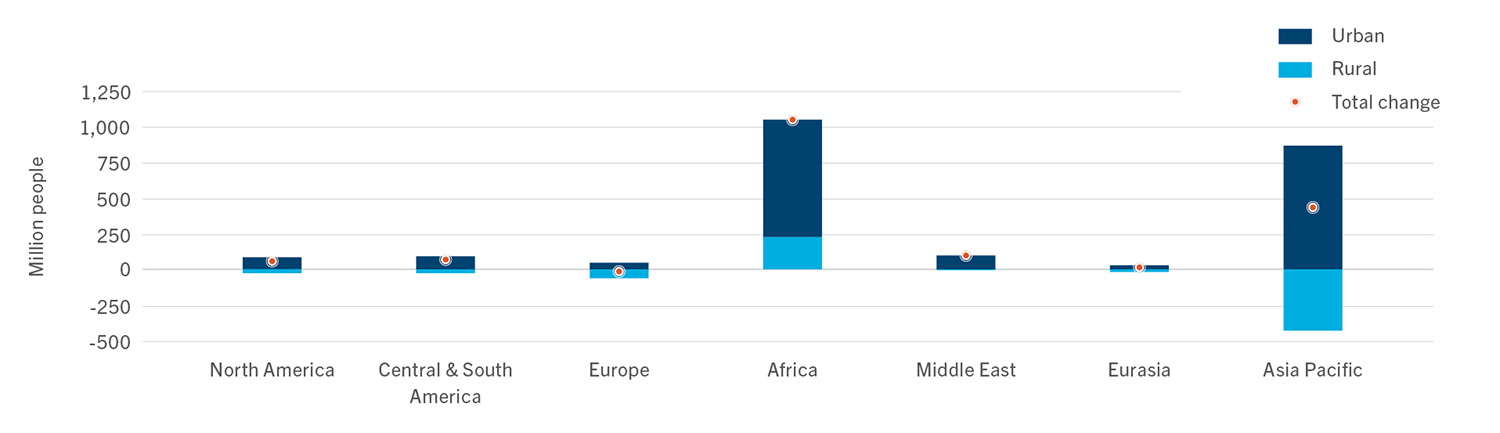
Except in Africa, the increase in population in the coming decades will be entirely concentrated in urban areas
Sources: UN DESA (2022); World Bank (2023b); IEA databases and analysis. IEA. CC BY 4.0
While energy access has increased worldwide, 760 million people still lack access to electricity. In parts of Africa, 80% of the population doesn’t have electricity and expanding access to electricity is unable to keep pace with the growing population.
Population without access to modern energy in the STEPS(6)
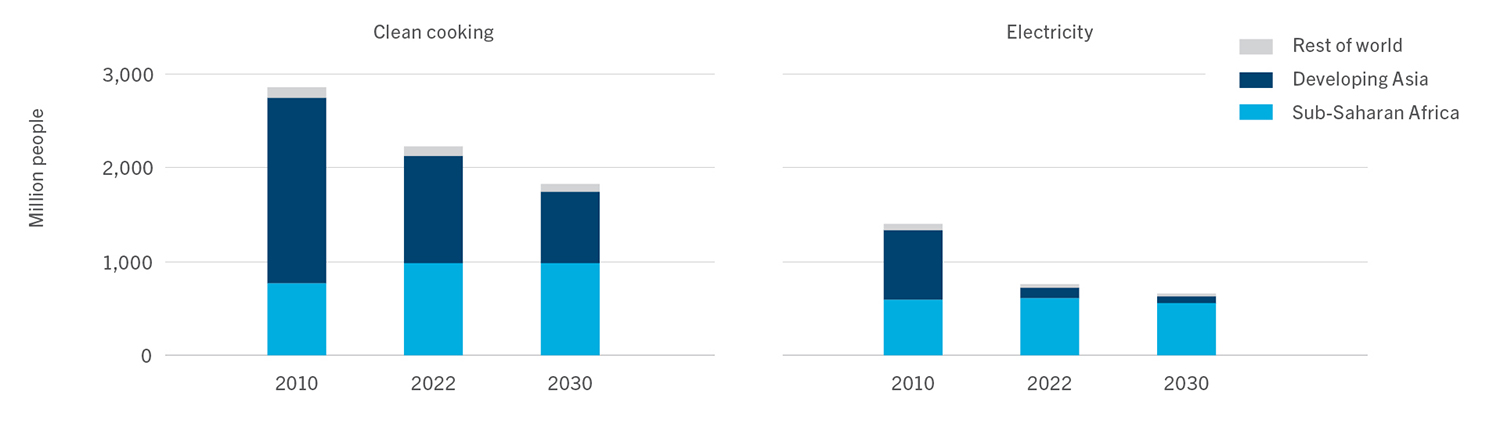
Number of people without access to clean cooking methods declines by more than 15% in the STEPs, and progress on electricity access remains slow
Note: Sub-Saharan Africa excludes South Africa. IEA. CC BY 4.0
Developing economies are working to balance energy needs and affordability with lower carbon pathways
Developing economies and emerging markets “face a diverse set of development challenges that will largely shape their regional energy, and emissions pathways.”(7) The decisions made by these countries, where approximately 64% of the world’s population lives, other than China, will have global implications.(7)
Historically, these countries have relied on carbon-intensive fossil fuels, but many are now exploring emerging markets and pathways that allow them to meet their energy access needs and support planned urban growth while reducing environmental pollutants.(8) However, undue financial burdens, such as having households shoulder the upfront costs of clean energy technologies, could play a role in their energy transition. As the WEO states, “political support for the transition can dissipate quickly if households or industries bear too much upfront cost without seeing tangible, near-term benefits.”(9)
The path to a lower carbon future must be affordable, based on secure supply, and strategically paced for consistent access and reliability.
The pathway to 1.5°C is limited but remains open
As the IEA reports, the pathway to net zero emissions by 2050 has narrowed but is still feasible. Continued optimism requires significant progress around clean energy policies, clean energy deployment, continued investment in innovation and emerging technologies, including infrastructure.
Increased energy options may limit fossil fuel demand
According to STEPS, the momentum behind clean energy transitions may be enough to taper fossil fuel demand by 2030. In this scenario, coal, oil and natural gas — typically making up about 80% of global energy supply — will edge down toward 73% through 2030. While this is a decrease in demand, these fossil fuels remain the dominant global fuel supply in all three scenarios.(10)
It’s important to note that while STEPS indicates a decrease in demand for fossil fuels; coal, oil and natural gas will decline at varying levels. Coal consumption will be the fuel most significantly impacted.(11)
Fossil fuel consumption by fuel in the STEPS, 2000 – 2050(12)
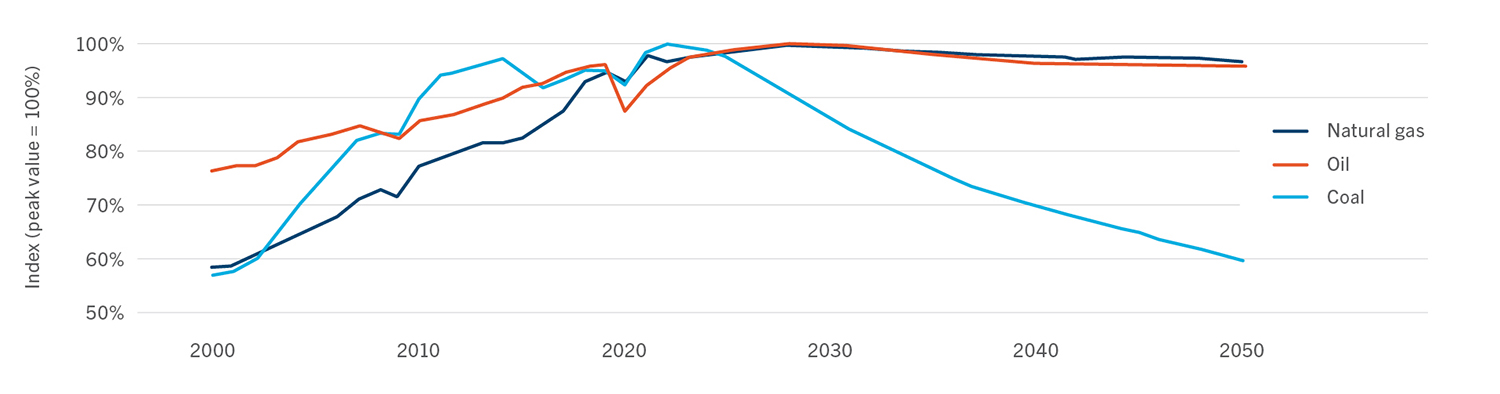
All fossil fuels peak before the end of this decade with declines in advanced economies, and China offsetting increasing demand elsewhere
As noted in the WEO, when considering these changes in demand (“trends”), there are important issues to consider:(13)
- Energy security challenges will remain for the foreseeable future.
- Demand trends for each fuel, particularly natural gas, vary by region and in some cases reduced demand in advanced economies can offset increased use in developing markets.
- The demand outlook will not be linear and will inevitably react to changing weather and geopolitical conditions.
- These changes are not steep enough to meet net zero ambitions.
Natural Gas Demand and Pricing
The WEO suggests the changes in natural gas demand reflect a “gradual rebalancing after the shocks of recent years.”(14) While demand does slow in STEPS, natural gas demand remains somewhat linear through 2050.(15)
In STEPS, natural gas prices stay relatively elevated as compared to pre-crisis levels. Various factors, including adjustment to the loss of Russian pipeline gas supply to Europe and a new wave of LNG export capacity, create gas market shifts. In the APS, an expected reduction in European natural gas demand may cause reduced prices and the NZE Scenario suggests a glut of natural gas supply.
For an alternative, policy independent pricing outlook, we also included the U.S. Energy Information Association (EIA)’s Henry Hub natural gas spot pricing projections for 2030 and 2050, which factors how the LNG market might impact natural gas pricing.
U.S. Natural Gas Prices by Scenario(16) as Compared to Chesapeake’s 2023 Breakeven Price Range: $2.35 – $2.70 (USD / Mbtu)
| EIA | STEPS | APS | NZE | |
|---|---|---|---|---|
| 2030 | $2.91 | $4.0 | $3.2 | $2.4 |
| 2050 | $3.77 | $4.3 | $2.2 | $2.0 |
The reported 2023 breakeven price range is based on internal company estimates for our positions in the Haynesville and Marcellus shales. If we continue to follow long-term market trends, our breakeven prices could benefit due to industry efficiencies, innovation and easing inflationary pressures. Also, as we continue to expand our global LNG market presence, we will be able to diversify revenues by accessing global pricing indices.
Chesapeake’s current breakeven prices reinforce the strength of our operational strategy and capital allocation flexibility, in addition to our formidable hedging strategy that helps ensure consistent future revenue. Our current scenario analysis only measures against U.S. pricing (the most conservative pricing offered by WEO), and specific to Chesapeake, we included inflation overhang.
Competing Market Share: Innovation and Agility Create Sustainability
Despite decreasing demand, natural gas remains a much relied upon global fuel through 2030 in all three scenarios. Producers that are innovative, agile and planning for a lower carbon future are most likely to retain (or grow) their market share. Nimble operators can best position themselves for sustainability by taking action on several recommendations posed by WEO.
| WEO Recommendations for a Lower Carbon Future | Chesapeake’s Action |
|---|---|
| Reduce methane emissions Methane abatement in the energy industry is one of the best ways to reduce GHG emissions globally.(17) | In support of our net zero emissions by 2035 goal, we committed to reduce our Scope 1 and Scope 2 methane intensity to 0.02% by 2025. Since 2020, we have reduced our methane intensity by 64% across our assets |
| Take advantage of the LNG market The global natural gas market increases nearly 15% by 2030 according to STEPS. Two-thirds of this market will be delivered as LNG with U.S. as the leading exporter.(18) | Our strategic portfolio positioning in the Haynesville offers the company significant LNG export opportunity. Our path to being LNG ready includes achieving value-driven scale, entering into supply agreements, and building out our network through overseas LNG joint ventures and marketing agreements among other initiatives. We view LNG as an important component to responsibly meeting the projected global energy demand throughout the transition. Chesapeake ultimately aims to dedicate 15 – 20% of its certified RSG production to LNG markets. |
| Support hydrogen and CCUS projects Under the right circumstances, progress from hydrogen and CCUS projects could be instrumental to meeting APS milestones.(19) | Through our NEV team, Chesapeake is actively exploring industry-adjacent solutions and emerging technologies, such as geothermal, CCUS and hydrogen energy development. Read more here. |
The WEO notes that “vigilance on oil and gas security remains essential throughout clean energy transitions,”(20) and the “extreme volatility in energy markets during the global energy crisis has highlighted the importance of affordable, reliable and resilient supply.”(21) As we phase out more carbon intensive resources, we must be able to sustain our current energy supply to meet growing demand both now and as it increases in the future. For this reason, we will rely on affordable and reliable forms of energy that are widely available now and into the future.